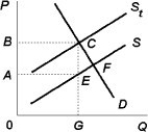
-Using the above figure, if the government levies a new unit tax in this market, S represents the original supply curve, and St represents the after-tax supply curve, then the revenues that the government collects from imposing this tax is represented on this graph by
A) OAEG.
B) OBCG.
C) BAEC.
D) CEF.
Correct Answer:
Verified
Q176: Q177: Q178: How would the market for coffee be Q179: If we wanted to analyze the effects Q180: Q182: Should the government wish to lower the Q183: The imposition of a tax on a Q184: If a state government wants to collect Unlock this Answer For Free Now! View this answer and more for free by performing one of the following actions Scan the QR code to install the App and get 2 free unlocks Unlock quizzes for free by uploading documents![]()
![]()
![]()

