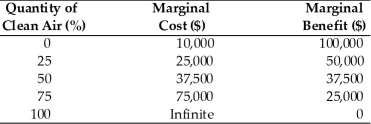
-The above table shows marginal costs and marginal benefits of clean air in a particular industrial area. In the table, when the quantity of clean air is at 75 percent
A) the quantity of polluted air is 75 percent.
B) the marginal benefit of clean air exceeds the marginal cost.
C) the marginal benefit of clean air is less than the marginal cost.
D) the quantity of clean air is optimal.
Correct Answer:
Verified
Q181: The marginal benefit of pollution abatement is
Q182: Q183: According to economic analysis, the optimal quantity Q184: Q185: Generally, as levels of pollution are reduced Q187: The level of pollution at which the Q188: Voluntary agreements about cleaning up pollution attempt Q189: The marginal cost of pollution abatement is Q190: Pollution Q191: Explain how the optimal quantity of air![]()
![]()
A)
A) creates a negative externality.
B) is increased
Unlock this Answer For Free Now!
View this answer and more for free by performing one of the following actions

Scan the QR code to install the App and get 2 free unlocks

Unlock quizzes for free by uploading documents