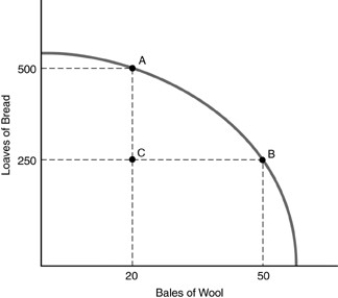
-Refer to the above figure. Which one of the following statements is true with regard to the economy depicted in the graph?
A) Point C cannot be produced.
B) The best production point is 500 loaves of bread and 50 bales of wool.
C) The total amount of resources it takes to produce 20 bales of wool and 500 loaves of bread is more than the amount of resources needed to produce 50 bales of wool and 250 loaves of bread.
D) The total amount of resources it takes to produce 20 bales of wool and 500 loaves of bread is the same as the amount of resources needed to produce 50 bales of wool and 250 loaves of bread.
Correct Answer:
Verified
Q263: Which of the following is held constant
Q266: Refer to the above figure. How do
Q267: During periods of unemployment
A) the economy operates
Q270: Efficiency is achieved
A) when output is being
Q273: Technology
A) is constantly changing at every point
Q274: The production possibilities curve for two products
Q275: Refer to the above figure. How do
Q277: A bowed-outward production possibilities curve demonstrates the
Q279: Refer to the above figure. Production at
Q293: In the above figure, the opportunity cost
Unlock this Answer For Free Now!
View this answer and more for free by performing one of the following actions

Scan the QR code to install the App and get 2 free unlocks

Unlock quizzes for free by uploading documents