The following graph shows the speed distributions for four different gases, all at the same temperature.Which of the curves is for the lightest gas? 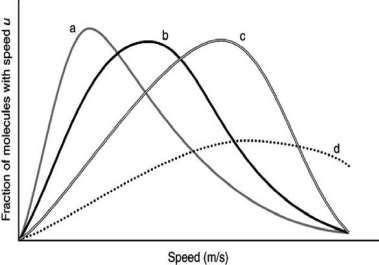
A) A
B) B
C) C
D) D
E) More information is needed.
Correct Answer:
Verified
Q20: A barometer measures a pressure of 745
Q33: At a given temperature, the rate at
Q34: Calculate the average kinetic energy of an
Q35: Calculate the average kinetic energy of CO2
Q36: Which of the following is NOT a
Q37: At a given temperature, oxygen gas effuses
Q39: Which of the following will have the
Q40: The root-mean-square speed of a gas
Q41: If the pressure in the eye of
Q43: At the top of Mt.Everest, which has
Unlock this Answer For Free Now!
View this answer and more for free by performing one of the following actions

Scan the QR code to install the App and get 2 free unlocks

Unlock quizzes for free by uploading documents