According to the data presented in the graph, between 1960 and 2000, CO2 levels rose approximately ppm. 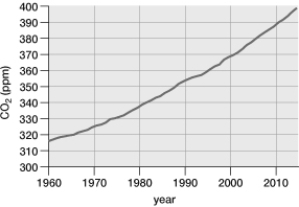
A) 50
B) 70
C) 370
D) 20
E) 320
Correct Answer:
Verified
Q103: Why is it so hard to make
Q104: It has been said about global warming
Q106: What would happen if there were no
Q107: On a field trip with your class
Q108: A rancher begins raising sheep on the
Q109: There is a school of thought that
Q110: The graph indicates that since 1960, global
Q114: The global phosphorus cycle is called a
Q115: Why is phosphorus so important to living
Q119: Sulfur dioxide is a natural product of
Unlock this Answer For Free Now!
View this answer and more for free by performing one of the following actions

Scan the QR code to install the App and get 2 free unlocks

Unlock quizzes for free by uploading documents