This graph, which is based on estimates from the International Panel on Climate Change (IPCC) , shows that by 2100, global temperatures may rise as much as above average levels in 2000. The dashed data line represents a high growth of greenhouse gas, the dotted data line represents a moderate growth of greenhouse gas, and the square data line represents a substantially reduced growth of greenhouse gas. 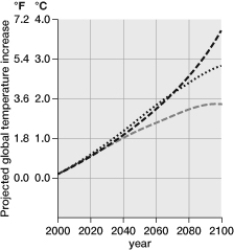
A) nearly 2°C
B) 2.5°C
C) 1°C
D) nearly 4°C
E) 3°C
Correct Answer:
Verified
Q82: Explain why a food web gives a
Q85: Organisms that produce their own food in
Q88: One of the basic principles of ecosystems
Q104: It has been said about global warming
Q108: A rancher begins raising sheep on the
Q110: What are some possible consequences of global
Q113: Nitrogen is fixed by soil bacteria and
Q115: Why is phosphorus so important to living
Q116: Plants cannot fix nitrogen, but legumes are
Q117: Why is acid rain or acid deposition
Unlock this Answer For Free Now!
View this answer and more for free by performing one of the following actions

Scan the QR code to install the App and get 2 free unlocks

Unlock quizzes for free by uploading documents