Multiple Choice
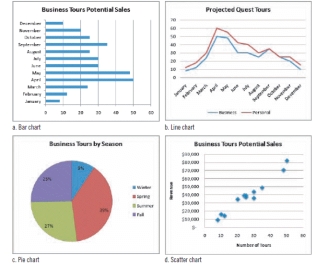
-Referring to the figure above, to show directions or trends in a linear data series over time you would use the ____ chart.
A) pie
B) bar
C) line
D) scatter
Correct Answer:
Verified
Related Questions
Q27: When modeling a decision using _ data,
Q28: On a decision tree, _ represent decisions.
A)
Q29: Bar charts are oriented _.
A) horizontally
B) vertically
C)
Q30: The second chart Helen is preparing is
Q31: A(n) _ typically defines a calculation that
Q33: A decision tree is a support tool
Unlock this Answer For Free Now!
View this answer and more for free by performing one of the following actions

Scan the QR code to install the App and get 2 free unlocks

Unlock quizzes for free by uploading documents