Figure 6.2
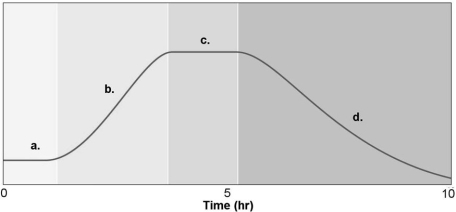
-Figure 6.2 shows a typical bacterial growth curve with the y-axis indicating the log of the number of bacteria and the x-axis indicating time in culture. In the figure, which sections of the graph illustrate a logarithmic change in cell numbers?
A) a and b
B) a and d
C) c and d
D) b and d
E) a and c
Correct Answer:
Verified
Q4: The biosafety level (BSL)for a clinical microbiology
Q5: Which of the following pairs of microbe
Q6: A culture medium consisting of agar, peptone,
Q7: If cells are grown in media containing
Q8: Which of the following is an advantage
Q12: Most bacteria grow best at pH
A) 7.
B)
Q13: The addition of which of the following
Q14: Thirty-six colonies grew in nutrient agar from
Q15: Which of the following elements is NOT
Q18: Figure 6.2
![]()
Unlock this Answer For Free Now!
View this answer and more for free by performing one of the following actions

Scan the QR code to install the App and get 2 free unlocks

Unlock quizzes for free by uploading documents