Multiple Choice
Figure 14.3 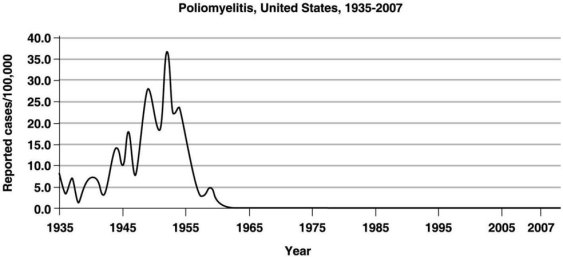 The graph in Figure 14.3 shows the incidence of polio in the United States. The period between 1945 and 1955 indicates a(n)
A) epidemic level.
B) communicable disease.
C) sporadic infection.
D) endemic level.
E) pandemic.
Correct Answer:
Verified
Related Questions
Q38: A cold transmitted by a facial tissue
Q39: Emergence of infectious diseases can be attributed
Q40: The method of transmission of the disease
Unlock this Answer For Free Now!
View this answer and more for free by performing one of the following actions

Scan the QR code to install the App and get 2 free unlocks

Unlock quizzes for free by uploading documents