What does the following figure represent? 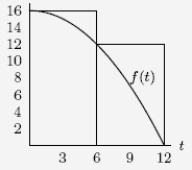
A) The right-hand Riemann sum for the function f on the interval 0 t 12 with t = 3.
B) The right-hand Riemann sum for the function f on the interval 0 t 12 with t = 6.
C) The left-hand Riemann sum for the function f on the interval 0 t 12 with t = 3.
D) The left-hand Riemann sum for the function f on the interval 0 t 12 with t = 6.
Correct Answer:
Verified
Q1: Estimate Q2: At time t, in seconds, the Q3: Consider the region A shown in the Q4: At time t, in seconds, your Q5: The figure below shows the graph of Q7: Consider a sports car which accelerates Q8: Two greyhound racing dogs, A and B, Q9: At time t, in seconds, your Q10: Estimate the area of the region Q11: The figure below shows the graph of
Unlock this Answer For Free Now!
View this answer and more for free by performing one of the following actions

Scan the QR code to install the App and get 2 free unlocks

Unlock quizzes for free by uploading documents