To study traffic flow along a major road, the city installs a device at the edge of the road at 1:00a.m.The device counts the cars driving past, and records the total periodically.The resulting data is plotted on a graph, with time (in hours since installation) on the horizontal axis and the number of cars on the vertical axis.The graph is shown below; it is the graph of the function C(t) = Total number of cars that have passed by after t hours.When is the traffic flow greatest? 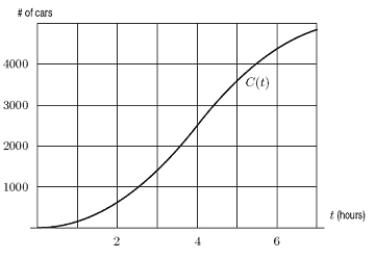
A) 2:00 am
B) 3:00 am
C) 4:00 am
D) 5:00 am
Correct Answer:
Verified
Unlock this Answer For Free Now!
View this answer and more for free by performing one of the following actions

Scan the QR code to install the App and get 2 free unlocks

Unlock quizzes for free by uploading documents