To study traffic flow along a major road, the city installs a device at the edge of the road at 3:00a.m.The device counts the cars driving past, and records the total periodically.The resulting data is plotted on a graph, with time (in hours since installation) on the horizontal axis and the number of cars on the vertical axis.The graph is shown below; it is the graph of the function C(t) = Total number of cars that have passed by after t hours.From the graph, estimate C'(6) . 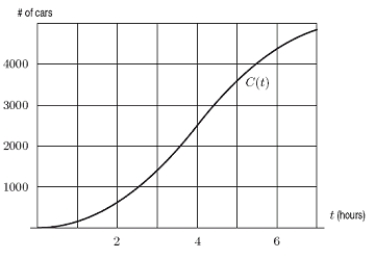
A) 600
B) 900
C) 1200
D) 1500
Correct Answer:
Verified
Q27: Find the derivative of
Q28: he graph below shows the velocity of
Q29: Find the derivative of
Q30: Could the first graph, A be the
Q31: Use the limit of the difference
Q33: A runner competed in a half marathon
Q34: The definition of the derivative function
Q35: Suppose that f(T)is the cost to
Q36: The graph below shows the velocity of
Q37: Use the definition of the derivative
Unlock this Answer For Free Now!
View this answer and more for free by performing one of the following actions

Scan the QR code to install the App and get 2 free unlocks

Unlock quizzes for free by uploading documents