The graph shows enzyme activity as a function of temperature for a mesophilic microbe. How would you predict that the graph would change if the organism was a psychrophile (an organism that thrives at low temperatures) ? 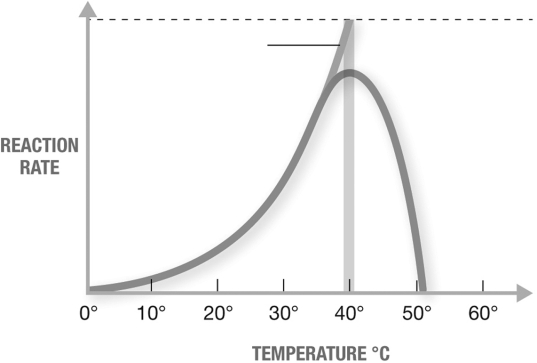
A) The graph would be similar, but would be shifted toward the right.
B) The graph would be a horizontal straight line.
C) The graph would be similar, but would be shifted toward the left.
D) The graph would not peak then drop off, but would continue rising indefinitely.
E) The graph would be wider (extended further both left and right) but the peak would be lower.
Correct Answer:
Verified
Q7: The figure shows which process? 
Q8: Ribozymes are enzymes which
A) are made of
Q9: Which coenzyme is incorrectly matched with its
Q10: Which of the following factors may influence
Q11: Catabolic and anabolic reactions depend upon each
Q13: Oxidation of nutrients by cells results in
A)
Q14: Which structural and functional feature(s) listed are
Q15: Enzymes are necessary for cells because
A) enzymes
Q16: Anabolic reactions
A) are endergonic.
B) involve dehydration synthesis.
C)
Q17: Which of the following does not describe
Unlock this Answer For Free Now!
View this answer and more for free by performing one of the following actions

Scan the QR code to install the App and get 2 free unlocks

Unlock quizzes for free by uploading documents