Use the following information for the next 4 questions.
SXF Corporation sells its single product for $14 per unit, and its variable cost per unit is $4. Total fixed costs are $800. Its CVP graph is as follows:
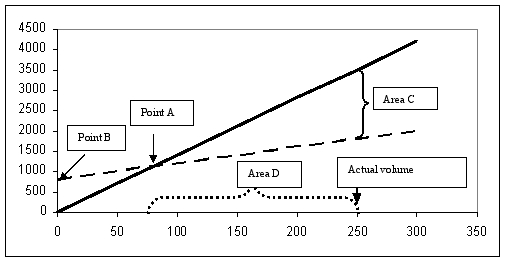
-Area C is best described as
A) Fixed cost
B) Margin of safety
C) Estimated profit at actual volume
D) Breakeven point
Correct Answer:
Verified
Q25: CVP analysis can be used in the
Q41: At the breakeven point:
A) Sales will be
Q42: The solid line intersects the y-axis at
Q43: The horizontal ("x") axis shows
A) Fixed costs
B)
Q45: The margin of safety is:
A) The difference
Q46: The area to the right of the
Q49: If fixed costs increase by 10% and
Q50: What is the relationship between the margin
Q57: The ratio of contribution margin / profit
Q72: If the total contribution margin decreases and
Unlock this Answer For Free Now!
View this answer and more for free by performing one of the following actions

Scan the QR code to install the App and get 2 free unlocks

Unlock quizzes for free by uploading documents