Figure 7.3
Assume 109 E. coli cells/ml are in a flask.
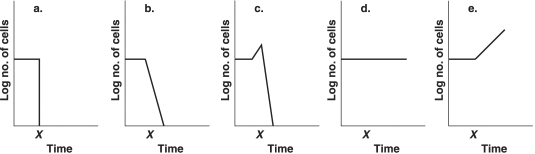
-Which graph in Figure 7.3 best depicts the effect of placing the culture at 7°C at time x?
A) a
B) b
C) c
D) d
E) e
Correct Answer:
Verified
Q6: Which of the following is not a
Q7: Which one of the following is most
Q8: Which of the following affects the elimination
Q9: All of the following contribute to hospital-
Q10: Which one of the following is most
Q12: Which of the following substances can sterilize?
A)
Q13: Foods are preserved with all of the
Q14: Which of these disinfectants acts by denaturing
Q15: The antimicrobial activity of chlorine is due
Q16: Table 7.1
A disk- diffusion test using
Unlock this Answer For Free Now!
View this answer and more for free by performing one of the following actions

Scan the QR code to install the App and get 2 free unlocks

Unlock quizzes for free by uploading documents