Multiple Choice
Figure 7.3
Assume 109 E. coli cells/ml are in a flask.
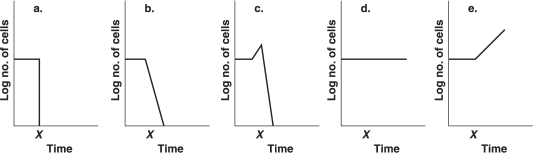
-Which graph in Figure 7.3 best depicts the effect of placing the culture in an autoclave for 15 min. at time x?
A) a
B) b
C) c
D) d
E) e
Correct Answer:
Verified
Related Questions
Q19: Which of the following is not used
Q20: Table 7.1
A disk- diffusion test using
Q21: Which of the following is a limitation
Q22: Which of the following pairs is not
Unlock this Answer For Free Now!
View this answer and more for free by performing one of the following actions

Scan the QR code to install the App and get 2 free unlocks

Unlock quizzes for free by uploading documents