Multiple Choice
Figure 6.2
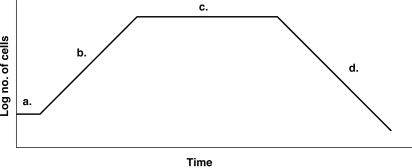
-In Figure 6.2, which sections of the graph illustrate a logarithmic change in cell numbers?
A) b and d
B) c and d
C) a and b
D) a and c
E) b only
Correct Answer:
Verified
Related Questions
Q32: Table 6.1
Below are three different culture
Q33: Table 6.2
The following data show growth

