Figure 5.7
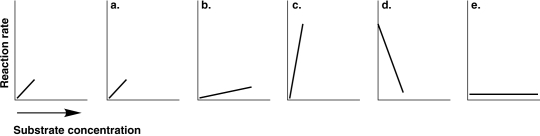
-The graph at the left of Figure 5.7 shows the reaction rate for an enzyme at its optimum temperature. Which graph shows enzyme activity at a higher temperature?
A) a
B) b
C) c
D) d
E) e
Correct Answer:
Verified
Q4: How is ATP generated in the reaction
Q5: All the following are true about substrate-
Q6: The advantage of the pentose phosphate pathway
Q7: Which of the following is not necessary
Q8: Uses glucose for carbon and energy.
A) Photoheterotroph
B)
Q10: Which of the following is not true
Q11: Which of the following compounds is not
Q12: Which of the following is not true
Q13: How many molecules of ATP can be
Q14: Which of the following is not an
Unlock this Answer For Free Now!
View this answer and more for free by performing one of the following actions

Scan the QR code to install the App and get 2 free unlocks

Unlock quizzes for free by uploading documents