Figure 14.3
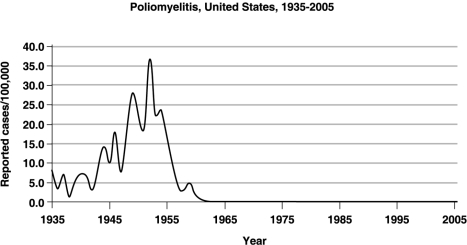
-The graph in Figure 14.3 shows the incidence of polio in the United States. The period between 1945 and 1955 indicates
A) A communicable disease.
B) An endemic level.
C) A sporadic infection.
D) An epidemic level.
E) None of the above.
Correct Answer:
Verified
Q22: A nosocomial infection is
A) Only a result
Q23: Mechanical transmission differs from biological transmission in
Q24: Which one of the following does not
Q25: Figure 14.1 Q26: The major significance of Koch's work was Q28: Gastroenteritis acquired from roast beef is an Q29: Situation 14.1 Q30: Pseudomonas bacteria colonized the bile duct of Q31: Which of the following is not a Q32: Nosocomial infections are most often caused by
![]()
During a 6-month period, 239 cases
A)
Unlock this Answer For Free Now!
View this answer and more for free by performing one of the following actions

Scan the QR code to install the App and get 2 free unlocks

Unlock quizzes for free by uploading documents