Given below is the scatter plot of the number of employees and the total revenue ($millions) of 20 U.S.companies.There appears to be a positive relationship between total revenue and the number of employees. 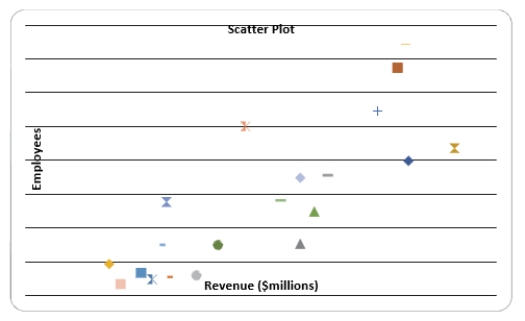
Correct Answer:
Verified
Q146: SCENARIO 2-17
The following table presents total retail
Q149: SCENARIO 2-14
The table below contains the
Q152: SCENARIO 2-14
The table below contains the
Q162: SCENARIO 2-18
The stem-and-leaf display below shows the
Q167: SCENARIO 2-18
The stem-and-leaf display below shows the
Q168: SCENARIO 2-18
The stem-and-leaf display below shows the
Q170: SCENARIO 2-18
The stem-and-leaf display below shows the
Q173: SCENARIO 2-15 The figure below is the
Q184: Given below is the scatter plot of
Q188: Given below is the scatter plot of
Unlock this Answer For Free Now!
View this answer and more for free by performing one of the following actions

Scan the QR code to install the App and get 2 free unlocks

Unlock quizzes for free by uploading documents