SCENARIO 2-2
2-2 Organizing and Visualizing Variables
At a meeting of information systems officers for regional offices of a national company,a survey was taken to determine the number of employees the officers supervise in the operation of their departments,where X is the number of employees overseen by each information systems officer.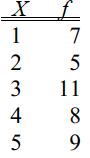
-The width of each bar in a histogram corresponds to the
A) differences between the boundaries of the class.
B) number of observations in each class.
C) midpoint of each class.
D) percentage of observations in each class.
Correct Answer:
Verified
Q8: SCENARIO 2-1
An insurance company evaluates many numerical
Q9: SCENARIO 2-3
Every spring semester,the School of Business
Q10: A professor of economics at a small
Q11: When constructing charts,the following is plotted at
Q12: SCENARIO 2-1
An insurance company evaluates many numerical
Q14: SCENARIO 2-5
The following are the duration in
Q15: SCENARIO 2-3
Every spring semester,the School of Business
Q16: SCENARIO 2-4
A survey was conducted to determine
Q17: SCENARIO 2-5
The following are the duration in
Q18: SCENARIO 2-4
A survey was conducted to determine
Unlock this Answer For Free Now!
View this answer and more for free by performing one of the following actions

Scan the QR code to install the App and get 2 free unlocks

Unlock quizzes for free by uploading documents