SCENARIO 14-1
The table below contains the sparklines for the rates of return (in percentage) for three different stocks from 2007 to 2013. 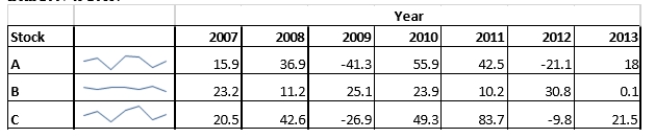
-Referring to SCENARIO 14-1, the rates of return of stock have the smallest variation among the three.
Correct Answer:
Verified
Q1: Which of the following investigates what should
Q2: Treemaps that use color to represent the
Q3: Some business analytics involve starting with many
Q6: Bullet graphs that use color to represent
Q9: Some business analytics involve starting with many
Q14: Which of the following finds relationships in
Q15: Which of the following explores business activities
Q17: Some business analytics involve starting with many
Q19: Most information design specialists prefer bullet graphs
Q20: Double-clicking a cell in a PivotTable causes
Unlock this Answer For Free Now!
View this answer and more for free by performing one of the following actions

Scan the QR code to install the App and get 2 free unlocks

Unlock quizzes for free by uploading documents