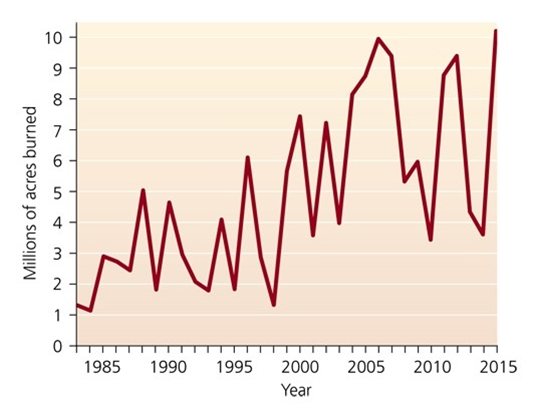
-This figure shows annual totals for area burned by wildfires in the U.S. from 1983 to 2015. Which of the following accounts for the trend shown?
A) Fire suppression has resulted in an accumulation of kindling for larger and more catastrophic wildfires during dry years.
B) We now fight fires more aggressively than we did in the 1980s, and the annual number of acres burned reflects these efforts.
C) Arsonists are starting more wildfires than they did 30 years ago.
D) Forest cover has been increasing in the U.S. since the 1980s, so we see an associated trend in the amount of forest burned annually.
E) There is no consistent trend in the figure. More forests burn during dry years than wet years.
Correct Answer:
Verified
Q1: Where will you find epiphytes growing?
A)on other
Q2: In the western U.S.,bark beetle outbreaks have
Q5: Many environmental advocates believe that biofuel made
Q8: Land trusts are _.
A)municipal government entities
B)state government
Q9: Which of the following is a consequence
Q11: The first national park was _
A)Yosemite
B)General Grant
Q12: The U.N.FAO's Global Forest Resources Assessment of
Q17: The _ system of timber harvesting involves
Q25: Prescribed burns would be used in forests
Q27: The program Reducing Emissions from Deforestation and
Unlock this Answer For Free Now!
View this answer and more for free by performing one of the following actions

Scan the QR code to install the App and get 2 free unlocks

Unlock quizzes for free by uploading documents