Multiple Choice
In the graph shown, the globally constrained potential output is: 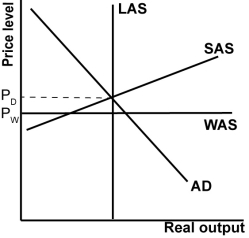
A) to the right of the LAS curve shown.
B) to the left of the LAS curve shown.
C) the same as the LAS curve shown.
D) the LAS curve shown, but horizontal.
Correct Answer:
Verified
Related Questions
Q41: Looking at the globalized AS/AD model, the
Q42: In the graph shown, the country has:
Q44: In the graph shown, which of the
Q46: When did structural stagnation begin according to
Q49: In the graph shown, what could balance
Unlock this Answer For Free Now!
View this answer and more for free by performing one of the following actions

Scan the QR code to install the App and get 2 free unlocks

Unlock quizzes for free by uploading documents