In the graph shown, what represents the trade deficit? 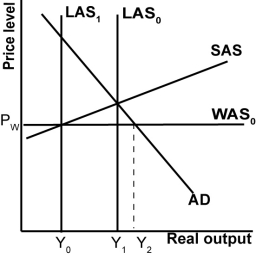
A) Y2 -Y1.
B) Y2 -Y0.
C) Y0.
D) Y1.
Correct Answer:
Verified
Q65: Refer to the graph shown.What will reduce
Q66: Looking at the graph shown, the structural
Q67: In the graph shown, what would shift
Q68: In the graph shown, what is globally
Q71: The most likely explanation for why the
Q73: In the graph shown, a shift in
Q74: The gap between a country's potential output
Q74: In the graph shown, a downward shift
Q82: Suppose a young person asked you for
Q97: The primary signal to policy makers that
Unlock this Answer For Free Now!
View this answer and more for free by performing one of the following actions

Scan the QR code to install the App and get 2 free unlocks

Unlock quizzes for free by uploading documents