Refer to the graph shown.The relationship represented in the figure is called a: 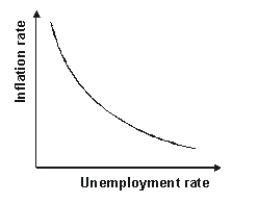
A) labor supply curve.
B) labor demand curve.
C) short-run Phillips curve.
D) long-run Phillips curve.
Correct Answer:
Verified
Q81: Suppose the money supply increases by 10
Q84: Which of the following statements is consistent
Q85: A reason that the quantity theory of
Q86: Which of the following is not one
Q90: According to institutionally-focused economists:
A)the direction of causation
Q91: The quantity theory of money:
A)is no longer
Q92: The institutionalist theory of inflation differs from
Q95: A reason that the quantity theory of
Q96: Stagflation is a combination of:
A)low and decelerating
Q110: The Phillips curve represents a relationship between:
A)inflation
Unlock this Answer For Free Now!
View this answer and more for free by performing one of the following actions

Scan the QR code to install the App and get 2 free unlocks

Unlock quizzes for free by uploading documents