Refer to the graph shown.Suppose the government borrows $50 million to finance an increase in its spending and that as a result, the level of investment is reduced by $50 million.In this case, the aggregate demand curve will: 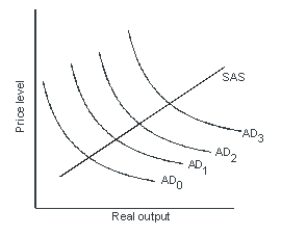
A) shift from AD0 to AD2 but then back to AD1.
B) shift from AD0 to AD2 but then out to AD3.
C) shift from AD0 to AD2.
D) not shift.
Correct Answer:
Verified
Q22: When the government runs a deficit, the
Q25: When the economy is experiencing inflation, an
Q27: Refer to the graph shown.Expansionary fiscal policy
Q29: An economist who follows a functional finance
Q31: Functional finance:
A)is based on empirical evidence that
Q32: Even as the U.S. government ran large
Q33: Reducing the budget deficit by cutting government
Q33: Refer to the graph shown.Expansionary fiscal policy
Q35: Which of the following is most representative
Q38: Fine tuning the economy with fiscal policy
Unlock this Answer For Free Now!
View this answer and more for free by performing one of the following actions

Scan the QR code to install the App and get 2 free unlocks

Unlock quizzes for free by uploading documents