Refer to the following graph. 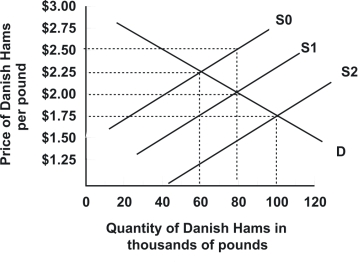 Demand and supply are initially D and S1 respectively.Which of the following best describes the effect of a $0.50 per pound tariff on Danish hams imported into the United States?
A) Supply shifts from S1 to S2; quantity sold rises to 100 thousand pounds and price paid by consumers declines to $1.75 a pound
B) Neither supply nor demand shift, but price paid by consumers declines to $1.50 a pound while quantity sold remains at 80 thousand pounds
C) Supply shifts from S1 to S0; quantity sold declines to 60 thousand pounds and price paid by consumers rises to $2.50 a pound
D) Supply shifts from S1 to S0; quantity sold declines to 60 thousand pounds and price paid by consumers rises to $2.25 a pound
Correct Answer:
Verified
Q56: When an effective price ceiling is removed,
Q56: Refer to the graph shown.Which of the
Q59: To keep the price of gas from
Q60: Refer to the graph shown.If government establishes
Q62: Tariffs can be thought of as indirect:
A)special
Q64: Suppose a price floor is imposed on
Q74: A tariff is:
A) a tax that government
Q96: If government were to issue a fixed
Q99: Quantity restrictions become more valuable to those
Q100: Quantity restrictions benefit which group the most?
A)
Unlock this Answer For Free Now!
View this answer and more for free by performing one of the following actions

Scan the QR code to install the App and get 2 free unlocks

Unlock quizzes for free by uploading documents