Refer to the graphs shown.Assume the graph reflects demand in the automobile market.Which arrow best captures the impact of increased gasoline prices on the automobile market? 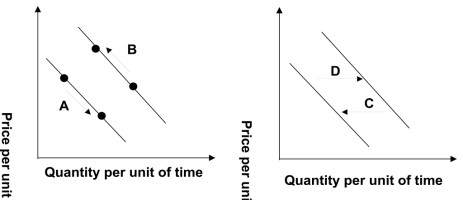
A) A
B) B
C) C
D) D
Correct Answer:
Verified
Q22: Which of the following would likely result
Q22: Tuition and fees for four year colleges
Q23: Refer to the graph shown.If the price
Q25: Refer to the graph shown.The quantity demanded
Q28: Assume the graph shown reflects demand in
Q33: Sometimes price cuts can have an unintended
Q34: According to the law of demand an
Q37: Given that diesel cars get much better
Q39: The growing popularity of a commercial weight-loss
Q43: To derive a market demand curve from
Unlock this Answer For Free Now!
View this answer and more for free by performing one of the following actions

Scan the QR code to install the App and get 2 free unlocks

Unlock quizzes for free by uploading documents