Refer to the graph shown.If the quantity supplied increases from 2 to 4 when the price of CDs increases from $2.00 to $5.00, the response by producers would be shown by: 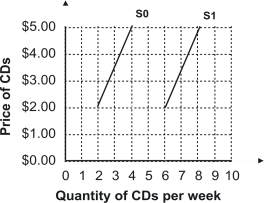
A) a shift from S0 toS1.
B) a shift from S1 toS0.
C) a movement upward and to the right alongS0.
D) a movement upward and to the right alongS1.
Correct Answer:
Verified
Q65: Which of the following would be expected
Q75: Refer to the graph shown.A shift from
Q81: Suppose the supply and demand tables shown
Q84: Suppose the given supply and demand tables
Q92: In the early 2000s car sales in
Q98: The supply of leather jackets would be
Q101: Price tends to be in equilibrium where
Q103: The point at which the supply curve
Q106: In the early 2000s, the number of
Q110: If supply and demand intersect at a
Unlock this Answer For Free Now!
View this answer and more for free by performing one of the following actions

Scan the QR code to install the App and get 2 free unlocks

Unlock quizzes for free by uploading documents