Refer to the graphs shown.The effect of increased consumer income and higher production costs on a normal good is most likely shown in: 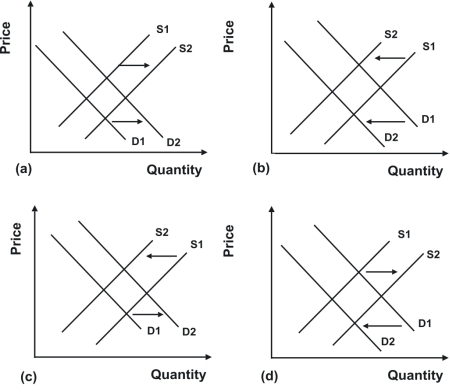
A) a.
B) b.
C) c.
D) d.
Correct Answer:
Verified
Q107: Refer to the graphs shown.The market is
Q108: Refer to the graphs shown.The market is
Q110: Refer to the graphs shown.The market is
Q114: Refer to the graphs shown.The consequences of
Q116: Refer to the graphs shown.Higher costs of
Q126: A decrease in the number of consumers
Q127: When the drug Vioxx was pulled from
Q134: Honey and jam are substitute products. If
Q135: When workers are paid higher wages, production
Q138: If market supply increases, equilibrium price will:
A)
Unlock this Answer For Free Now!
View this answer and more for free by performing one of the following actions

Scan the QR code to install the App and get 2 free unlocks

Unlock quizzes for free by uploading documents