The production possibility table below on the left is for growing broccoli and asparagus in a 320-square-foot garden in one season. 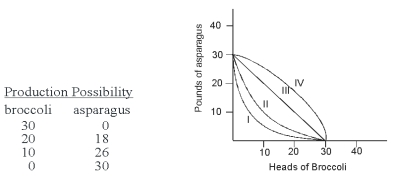 Which curve on the graph on the right corresponds to this table?
A) I
B) II
C) III
D) IV
Correct Answer:
Verified
Q6: If the principle of increasing marginal opportunity
Q7: The production possibility model can be used
Q8: Refer to the graph below. 
Q10: Which of the following cannot be determined
Q11: If a country has a comparative advantage
Q13: Suppose each of the following rows represents
Q14: Productive efficiency is not achieved at any
Q14: Refer to the production possibility curve for
Q16: Evan can grow both roses and carnations
Q20: Because you can get more of one
Unlock this Answer For Free Now!
View this answer and more for free by performing one of the following actions

Scan the QR code to install the App and get 2 free unlocks

Unlock quizzes for free by uploading documents