This production possibility table illustrates: 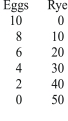
A) increasing marginal opportunity cost.
B) decreasing marginal opportunity cost.
C) constant marginal opportunity cost.
D) zero opportunity cost.
Correct Answer:
Verified
Q35: Refer to the graph below. 
Q36: When you produce cars, it is enormously
Q37: Given the production possibility curve shown, the
Q38: The principle of increasing marginal opportunity cost
Q39: In the graph shown, what change would
Q41: Refer to the graph below.
Q42: Refer to the graph below.
Q44: The graph below indicates that the economy
Q44: The term efficiency involves achieving a goal
Q51: A resource is said to have a
Unlock this Answer For Free Now!
View this answer and more for free by performing one of the following actions

Scan the QR code to install the App and get 2 free unlocks

Unlock quizzes for free by uploading documents