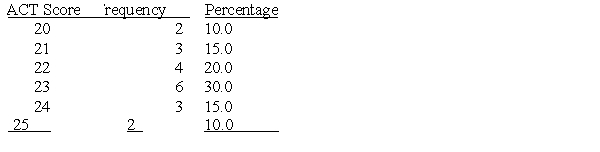
Use the following frequency distribution to answer questions
-Which of the following graphs is most appropriate when displaying categorical data?
A) scatterplot
B) bar graph
C) histogram
D) any of the above
Correct Answer:
Verified
Q5: Use the following frequency distribution to answer
Q6: When drawing a line graph, the dependent
Q7: A correlation coefficient is used to:
A) examine
Q8: Use the following frequency distribution to answer
Q9: The relationship between number of friends and
Q11: Use the following frequency distribution to answer
Q12: Inferential statistics involve the use of _to
Q13: The use of descriptive statistics involves
A) summarizing
Q14: What type of graph would be appropriate
Q15: Use the following frequency distribution to answer
Unlock this Answer For Free Now!
View this answer and more for free by performing one of the following actions

Scan the QR code to install the App and get 2 free unlocks

Unlock quizzes for free by uploading documents