Twenty-five assembly-line workers participated in a study to investigate the relationship between experience and the amount of time required to complete an assembly task. Assembly time (in minutes) and number of months the worker had been employed on the assembly line were measured for each worker. The resulting data on y = time to complete assembly and x = number of months on the assembly line were used to produce the scatterplot and computer output below. 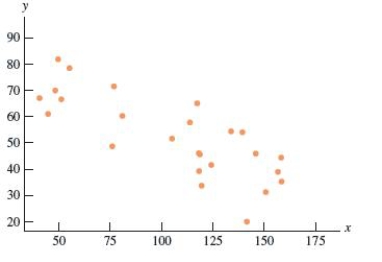
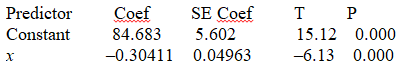
S = 9.79097 R-Sq = 62.0% R-Sq(adj) = 60.4%
Which of the following is the value of the intercept of the least squares regression line?
A) 5.602
B) -0.30411
C) 0.04963
D) 15.12
E) 84.683
Correct Answer:
Verified
Q11: What is it that the Pearson correlation
Q32: Exhibit 4-3
Paleontology, the study of forms of
Q33: The data below were gathered on a
Q34: If a scatter plot exhibits a strong
Q36: In the 19th Century, venereal diseases were
Q38: When children and adolescents are discharged from
Q39: Exhibit 4-3
Paleontology, the study of forms of
Q40: Exhibit 4-1
The preservation of objects made of
Q41: The model W = a + bL
Q42: Exhibit 4-2
The theory of fiber strength suggests
Unlock this Answer For Free Now!
View this answer and more for free by performing one of the following actions

Scan the QR code to install the App and get 2 free unlocks

Unlock quizzes for free by uploading documents