The data below were gathered on a random sample of 5 basking sharks, swimming through the water and filter-feeding, i.e. passively letting the water bring food into their mouths. 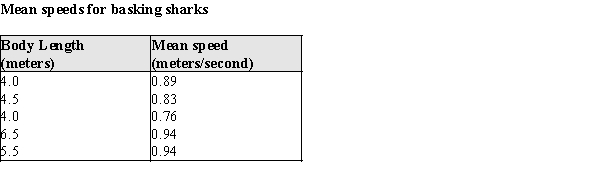
a)What is the value of the correlation coefficient for these data?
b)What is the equation of the least squares line describing the relationship between
x = body length and y = mean speed.
c)If these sharks are representative of the population of basking sharks, what would you predict is the mean speed for a filter-feeding basking shark that is 5.0 meters in length? Show any calculations below.
d)The largest basking shark in the sample is measured as 6.5 meters long. Theory predicts a maximum length of about 12.26 meters. Would it be reasonable to use the equation from part (b) above to predict the mean filter-feeding speed for a 12 meter long basking shark? Why or why not?
Correct Answer:
Verified
b)
c)0.61...
View Answer
Unlock this answer now
Get Access to more Verified Answers free of charge
Q1: One of the properties of Pearson's r
Q12: The standard deviation about the least squares
Q16: One of the properties of Pearson's r
Q21: If a scatter plot exhibits a strong
Q23: The Des Moines Register recently reported the
Q24: The Des Moines Register recently reported the
Q26: Consider the following five scatterplots. All are
Q27: Exhibit 4-1
The preservation of objects made of
Q28: Data on x = the weight of
Q29: The use of small aircraft with human
Unlock this Answer For Free Now!
View this answer and more for free by performing one of the following actions

Scan the QR code to install the App and get 2 free unlocks

Unlock quizzes for free by uploading documents