Exhibit 4-6
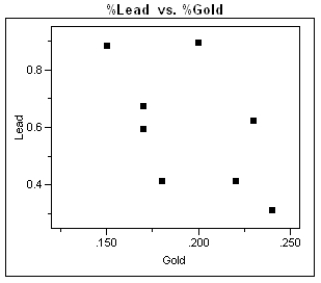
During the first 3 centuries AD, the Roman Empire produced coins in the Eastern provinces. Some historians argue that not all these coins were produced in Roman mints, and further that local provincial mints struck some of them. Because the "style" of coins is difficult to analyze, the historians would like to use metallurgical analysis as one tool to identify the source mints of these coins. Investigators studied 8 coins known to have been produced by the mint in Rome in an attempt to identify a trace element profile for these coins, and have identified gold and lead as possible factors in identifying other coins as having been minted in Rome. The gold and lead content, measured as a % of weight of each coin, is given in the table, and a scatter plot of these data is presented below. 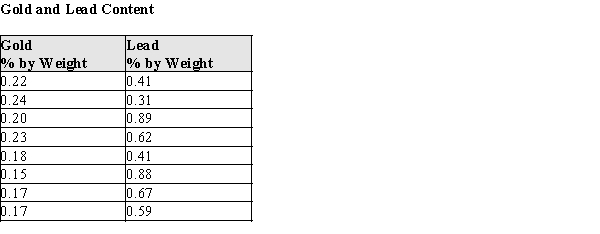
-Refer to Exhibit 4-6.
a)What is the equation of the least squares best fit line?
b)Sketch the best fit line on the scatter plot.
c)What is the value of the correlation coefficient? Interpret this value.
d)What is the value of the coefficient of determination? Give an interpretation of this value.
Correct Answer:
Verified
View Answer
Unlock this answer now
Get Access to more Verified Answers free of charge
Q30: Assessing the goodness of fit of a
Q46: Exhibit 4-2
The theory of fiber strength suggests
Q48: Assessing the goodness of fit of a
Q49: Polar bear cubs are born in the
Q50: Exhibit 4-2
The theory of fiber strength suggests
Q52: Suppose that the locally minted coins analyzed
Q53: Exhibit 4-7
Golden-rumped elephant shrews have long flexible
Q54: One of the problems when estimating the
Q55: Exhibit 4-7
Golden-rumped elephant shrews have long flexible
Q56: Exhibit 4-5
During the first 3 centuries AD,
Unlock this Answer For Free Now!
View this answer and more for free by performing one of the following actions

Scan the QR code to install the App and get 2 free unlocks

Unlock quizzes for free by uploading documents