A common statistical method for estimating a population size assumes each member of the population has an equal probability of being captured. To assess this assumption for crocodile populations, investigators repeatedly sampled sections of rivers in Australia. Crocodile lengths were measured in size classes. Crocs 0.0 - 0.3 meters in length are in size class 1, 0.3 - 0.6 meters in length are size class 2, etc. The normal maximum adult length is in a class size of 9 or 10. The investigators fit a quadratic function relating the probability of capture and the size class of captured crocodiles. The output from their analysis is shown below. 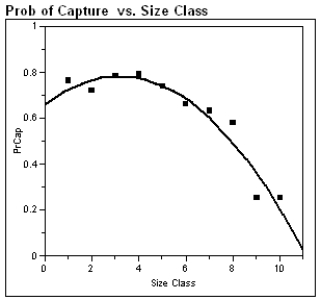 Polynomial Fit Degree=2
PrCap = 0.66 + 0.77Class − 0.01(Class)^2 
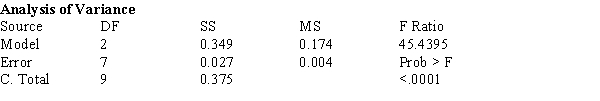
(a)What proportion of the variability in probability of capture is explained by the crocodile's size class?
(b)Some biologists speculate that as crocodiles grow they become more wary of humans, and are more difficult to detect in the wild. Support or refute this belief by appealing to the analysis above.
Correct Answer:
Verified
b)This belief appea...
View Answer
Unlock this answer now
Get Access to more Verified Answers free of charge
Q30: Assessing the goodness of fit of a
Q40: Exhibit 4-1
The preservation of objects made of
Q41: The model W = a + bL
Q42: Exhibit 4-2
The theory of fiber strength suggests
Q43: Suppose that the coins analyzed in Exhibit
Q44: Exhibit 4-4:
Biological theory suggests that the relationship
Q46: Exhibit 4-2
The theory of fiber strength suggests
Q48: Assessing the goodness of fit of a
Q49: Polar bear cubs are born in the
Q50: Exhibit 4-2
The theory of fiber strength suggests
Unlock this Answer For Free Now!
View this answer and more for free by performing one of the following actions

Scan the QR code to install the App and get 2 free unlocks

Unlock quizzes for free by uploading documents