The dot plot below shows the annual salaries, in thousands of dollars, of a sample of non-management staff who work for a small banking company. 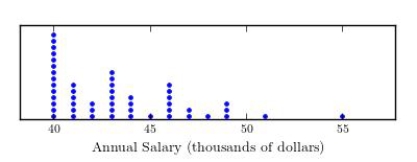 Which of the following statistics would be the most reasonable estimate of the typical annual salary?
A) mean
B) mode
C) median
D) interquartile range
E) range
Correct Answer:
Verified
Q5: Exhibit 3-2
In 1990 the New York
Q7: The questions below refer to decisions made
Q8: Costs per serving (in cents) for 16
Q9: Exhibit 3-2
In 1990 the New York
Q10: The interquartile range is resistant to the
Q12: A common topic of study among biologists
Q13: The table below summarizes the number of
Q14: Suppose that the distribution of weekly water
Q15: The mean number of text messages sent
Q18: The mean is the middle value of
Unlock this Answer For Free Now!
View this answer and more for free by performing one of the following actions

Scan the QR code to install the App and get 2 free unlocks

Unlock quizzes for free by uploading documents