Which of the five boxplots shown in figure corresponds to a data set with the 5-number summary below?
Minimum: 60
Lower Quartile: 69
Median: 76
Upper Quartile: 82
Maximum: 89
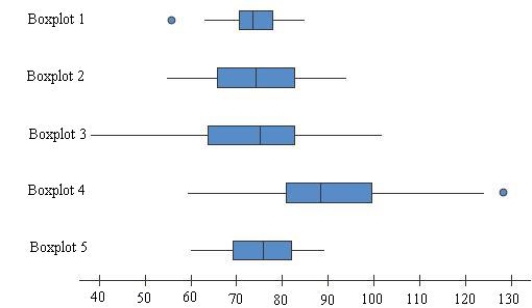
A) Boxplot 1
B) Boxplot 2
C) Boxplot 3
D) Boxplot 4
E) Boxplot 5
Correct Answer:
Verified
Q1: For any given data set, the median
Q12: If there are no outliers, a skeletal
Q12: A common topic of study among biologists
Q13: The table below summarizes the number of
Q14: Suppose that the distribution of weekly water
Q15: The mean number of text messages sent
Q19: Data on tipping percent for 20 restaurant
Q20: Data on weekday exercise time (in minutes)
Q21: A wide variety of oak trees grow
Q22: Spotrac publishes professional football players' salaries. The
Unlock this Answer For Free Now!
View this answer and more for free by performing one of the following actions

Scan the QR code to install the App and get 2 free unlocks

Unlock quizzes for free by uploading documents