A survey asked adult respondents how dependent they were on various electronic devices. The accompanying table summarizes the responses. 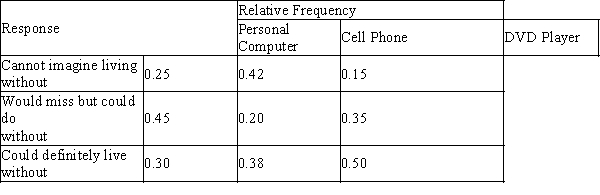 Select a comparative bar chart that shows the distributions of responses for the three different technologies.
A) 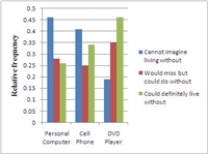
B) 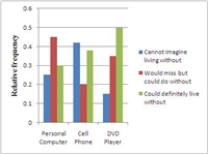
C) 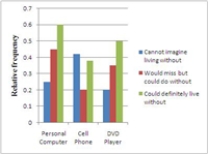
D) 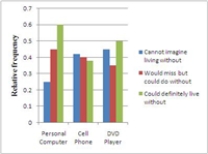
E) 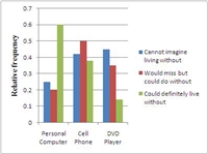
Correct Answer:
Verified
Q8: If the upper tail of a distribution
Q8: The following relative frequency distribution summarizes student
Q9: Bar charts should be used with categorical
Q9: An outlier is an unusually small or
Q12: A pie chart is most useful for
Q12: Dotplots work best for small and moderate
Q13: Which of the following variables are discrete?
Q16: In a scatter plot, both the horizontal
Q16: The quantity Q17: For stem and leaf plots with single-digit![]()
Unlock this Answer For Free Now!
View this answer and more for free by performing one of the following actions

Scan the QR code to install the App and get 2 free unlocks

Unlock quizzes for free by uploading documents