Exhibit 2-2
In a story written in December 2002, the Des Moines Register reported on the percentages of students who qualify for Free/Reduced lunch programs in the elementary schools in Des Moines, Iowa. The data, by elementary school, appears in the table below.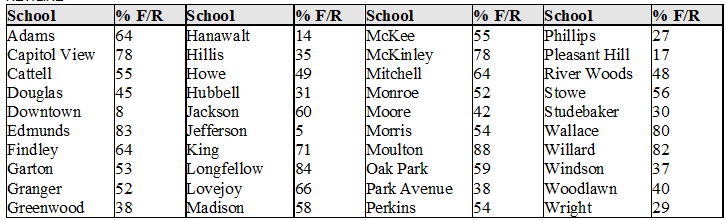
-Refer to Exhibit 2-2.
(a)Construct a histogram for these data, using the following class intervals:
0 to < 20
20 to < 40, etc.
(b)Describe the distribution of Free/Reduced eligibility percents, and note any unusual features.
Correct Answer:
Verified
View Answer
Unlock this answer now
Get Access to more Verified Answers free of charge
Q3: In a psychological study of distance perception,
Q26: Ruminants are hoofed animals such as cattle
Q27: The cumulative relative frequency plot shown was
Q28: Exhibit 2-4
In the article, "Scaling of Mammalian
Q29: The most important right and responsibility of
Q30: Artificial nest have often been used when
Q32: Biologists know that bats have different flight
Q33: In a study of how college students
Q35: The stem plot below displays the weights
Q36: One interesting aspect of surveys is that
Unlock this Answer For Free Now!
View this answer and more for free by performing one of the following actions

Scan the QR code to install the App and get 2 free unlocks

Unlock quizzes for free by uploading documents