Samples from two independent, normally-distributed populations produced the following results. 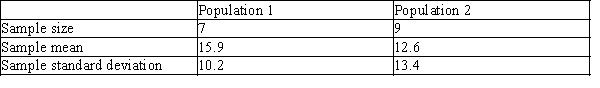 Calculate the 95% confidence interval for the difference between population means, µ1-µ2
A) (-9.65, 15.65)
B) (-8.26, 14.86)
C) (-10.10, 16.74)
D) (-0.55, 2.54)
Correct Answer:
Verified
Q2: When testing hypotheses about and constructing confidence
Q3: Karl is a software developer who is
Q4: Body fat and lean body mass can
Q5: For two independent samples, Q6: A researcher investigates the effect of a Q8: The data below give the weights in Q10: Researchers have hypothesized that female Downy Woodpeckers Q11: When testing a hypothesis concerning the difference Q12: Samples from two independent, normally-distributed populations produced Q16: The number of degrees of freedom used![]()
Unlock this Answer For Free Now!
View this answer and more for free by performing one of the following actions

Scan the QR code to install the App and get 2 free unlocks

Unlock quizzes for free by uploading documents