Multiple Choice
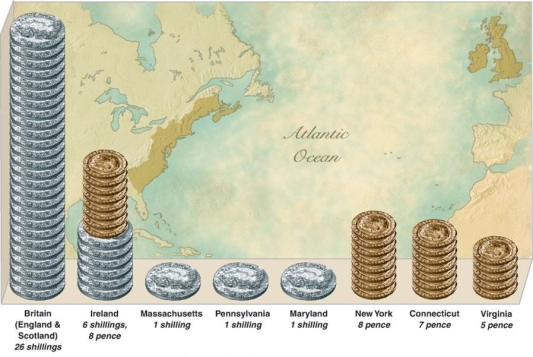
-What conclusion can be reached by interpreting this graph that compares annual per capita tax rates between Britain and its American colonies in 1765?
A) Americans paid more than their fair share of taxes to support the British Empire.
B) Americans opposed taxation because they were not represented in Parliament.
C) British citizens paid less tax money than the colonists in America and Ireland.
D) Americans were generally wealthier than comparable workers in Britain.
Correct Answer:
Verified
Related Questions

