The following table provides data for an economy in a certain year._ 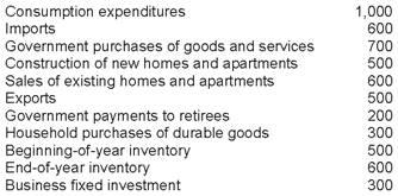 Given the data in the table, how much did households spend on nondurables and services?
A) 300
B) 700
C) 1,000
D) 1,300
Correct Answer:
Verified
Q90: The following table provides data for an
Q91: The following table provides data for an
Q92: The following table provides data for an
Q98: The following table provides data for an
Q99: An economy produces 500,000 tables valued at
Q100: The following table provides data for an
Q101: An economy produces 1,000,000 computers valued at
Q102: GDP can be measured as each of
Q116: An economy produces 500,000 tables valued at
Q117: An economy produces only 500,000 tables valued
Unlock this Answer For Free Now!
View this answer and more for free by performing one of the following actions

Scan the QR code to install the App and get 2 free unlocks

Unlock quizzes for free by uploading documents