Which one of the following graphs illustrates how capacitive reactance varies with frequency? 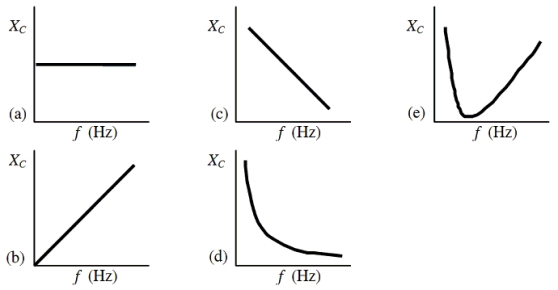
A) a
B) b
C) c
D) d
E) e
Correct Answer:
Verified
Q2: The graph shows the voltage across
Q3: Three 4.0-µF capacitors are connected in
Q4: What is the capacitive reactance of
Q5: The graph shows the voltage across and
Q6: A variable inductor is connected to an
Q7: The reactance of a capacitor in
Q11: A battery is used to drive a
Q12: The graph shows the voltage across and
Q15: A variable capacitor is connected to an
Q16: Two 3.25-µF capacitors are connected in series
Unlock this Answer For Free Now!
View this answer and more for free by performing one of the following actions

Scan the QR code to install the App and get 2 free unlocks

Unlock quizzes for free by uploading documents