Which one of the following graphs shows how the inductive reactance varies with frequency? 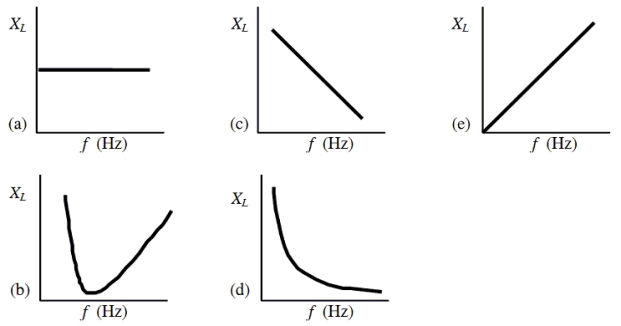
A) a
B) b
C) c
D) d
E) e
Correct Answer:
Verified
Q1: The graph shows the voltage across and
Q4: What is the capacitive reactance of
Q5: The graph shows the voltage across and
Q8: The graph shows the voltage across
Q11: A battery is used to drive a
Q13: An ac generator is connected across
Q15: A variable capacitor is connected to an
Q18: An ac voltage source that has a
Q29: For which one of the following circuit
Q33: Complete the following statement: When the current
Unlock this Answer For Free Now!
View this answer and more for free by performing one of the following actions

Scan the QR code to install the App and get 2 free unlocks

Unlock quizzes for free by uploading documents