Given the following data for total sales: A table showing trend percentages for 2008- 2011, respectively, using 2008 as the base year, would show for 2009- 2011: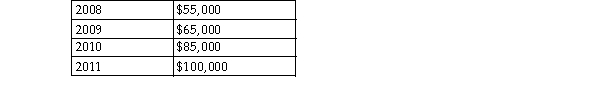
A) 15%, 26%, and 15%.
B) 118%, 155%, and 182%.
C) 65%, 85%, and 100%.
D) 18%, 3%, and 8%.
Correct Answer:
Verified
Q3: Anacortes Corporation reports the following data:
Q4: Accounts Receivable was $45,000 at the beginning
Q5: The cost of capital is defined as
Q6: Horizontal analysis focuses on:
A)percentage and/or dollar amount
Q7: Which of the following is typically used
Q10: Total revenues and net income for 2008
Q11: If a balance sheet is subjected to
Q12: If cost of goods sold for the
Q13: Spaceship Enterprises has a current ratio of
Q65: Which of the following would be useful
Unlock this Answer For Free Now!
View this answer and more for free by performing one of the following actions

Scan the QR code to install the App and get 2 free unlocks

Unlock quizzes for free by uploading documents