Which of the diagrams given below corresponds to a budget line that involves an increase in nonlabour income? (a) 
(c) 
(b) 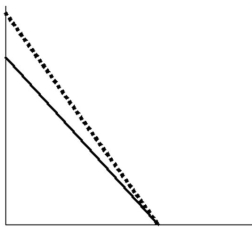
(d) 
A) (a)
B) (b)
C) (c)
D) (d)
Correct Answer:
Verified
Q14: The portion of the population that is
Q15: Our income-leisure model suggests that a worker
Q16: The reservation wage is defined as:
A) the
Q17: Which of the following statements applies to
Q18: Which of the following groups of workers
Q20: Consider the situation of a worker who
Q21: Which of the following diagrams corresponds to
Q22: The wage rate at which the individual
Q23: A major and recurring theme of this
Q24: Which of the diagrams given below corresponds
Unlock this Answer For Free Now!
View this answer and more for free by performing one of the following actions

Scan the QR code to install the App and get 2 free unlocks

Unlock quizzes for free by uploading documents