Figure 3.4
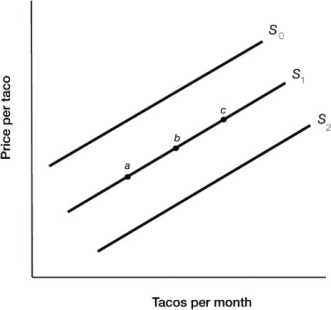
-Figure 3.4 illustrates the supply of tacos. A decrease in the supply of tacos is represented by a movement from
A) point a to point b.
B) point c to point b.
C) S2 to S1.
D) S0 to S1.
Correct Answer:
Verified
Q76: Q82: If the population increases, the market demand Q86: Figure 3.4 Q91: If demand for a product increases, ceteris Q111: A decrease in population would shift the Q116: Describe the changes in the variables that Q119: Explain the difference between a change in Q121: Suppose that consumers expect the price of Q128: Suppose that consumers expect that the price Q167: People will buy more of a normal![]()
![]()
Unlock this Answer For Free Now!
View this answer and more for free by performing one of the following actions

Scan the QR code to install the App and get 2 free unlocks

Unlock quizzes for free by uploading documents